Documentation Index
Fetch the complete documentation index at: https://qovery-fix-azure-rg-scoped-permissions-docs.mintlify.app/llms.txt
Use this file to discover all available pages before exploring further.
Overview
Datadog is one of the leading platforms for infrastructure monitoring, log management, Application Performance Monitoring (APM), and more. This guide walks you through deploying the Datadog Agent on a Qovery-managed Kubernetes cluster using Helm.Architecture
The Datadog Helm chart deploys three main components on your cluster:| Component | Type | Role |
|---|---|---|
| Node Agent | DaemonSet | Runs on every node. Collects metrics, logs, and traces from the node and its pods |
| Cluster Agent | Deployment | Centralized collection of cluster-level metadata (events, leader election, external metrics) |
| Cluster Check Runners | Deployment (optional) | Run cluster checks (e.g., database monitoring) without tying them to a specific node |
Prerequisites
Before you begin, this guide assumes the following:- You have a Qovery cluster running
- You have a dedicated Qovery project and environment to deploy Datadog (example: Project=
Tooling, Environment=Production) - You have a Datadog account
| Variable | Where to find it | Required |
|---|---|---|
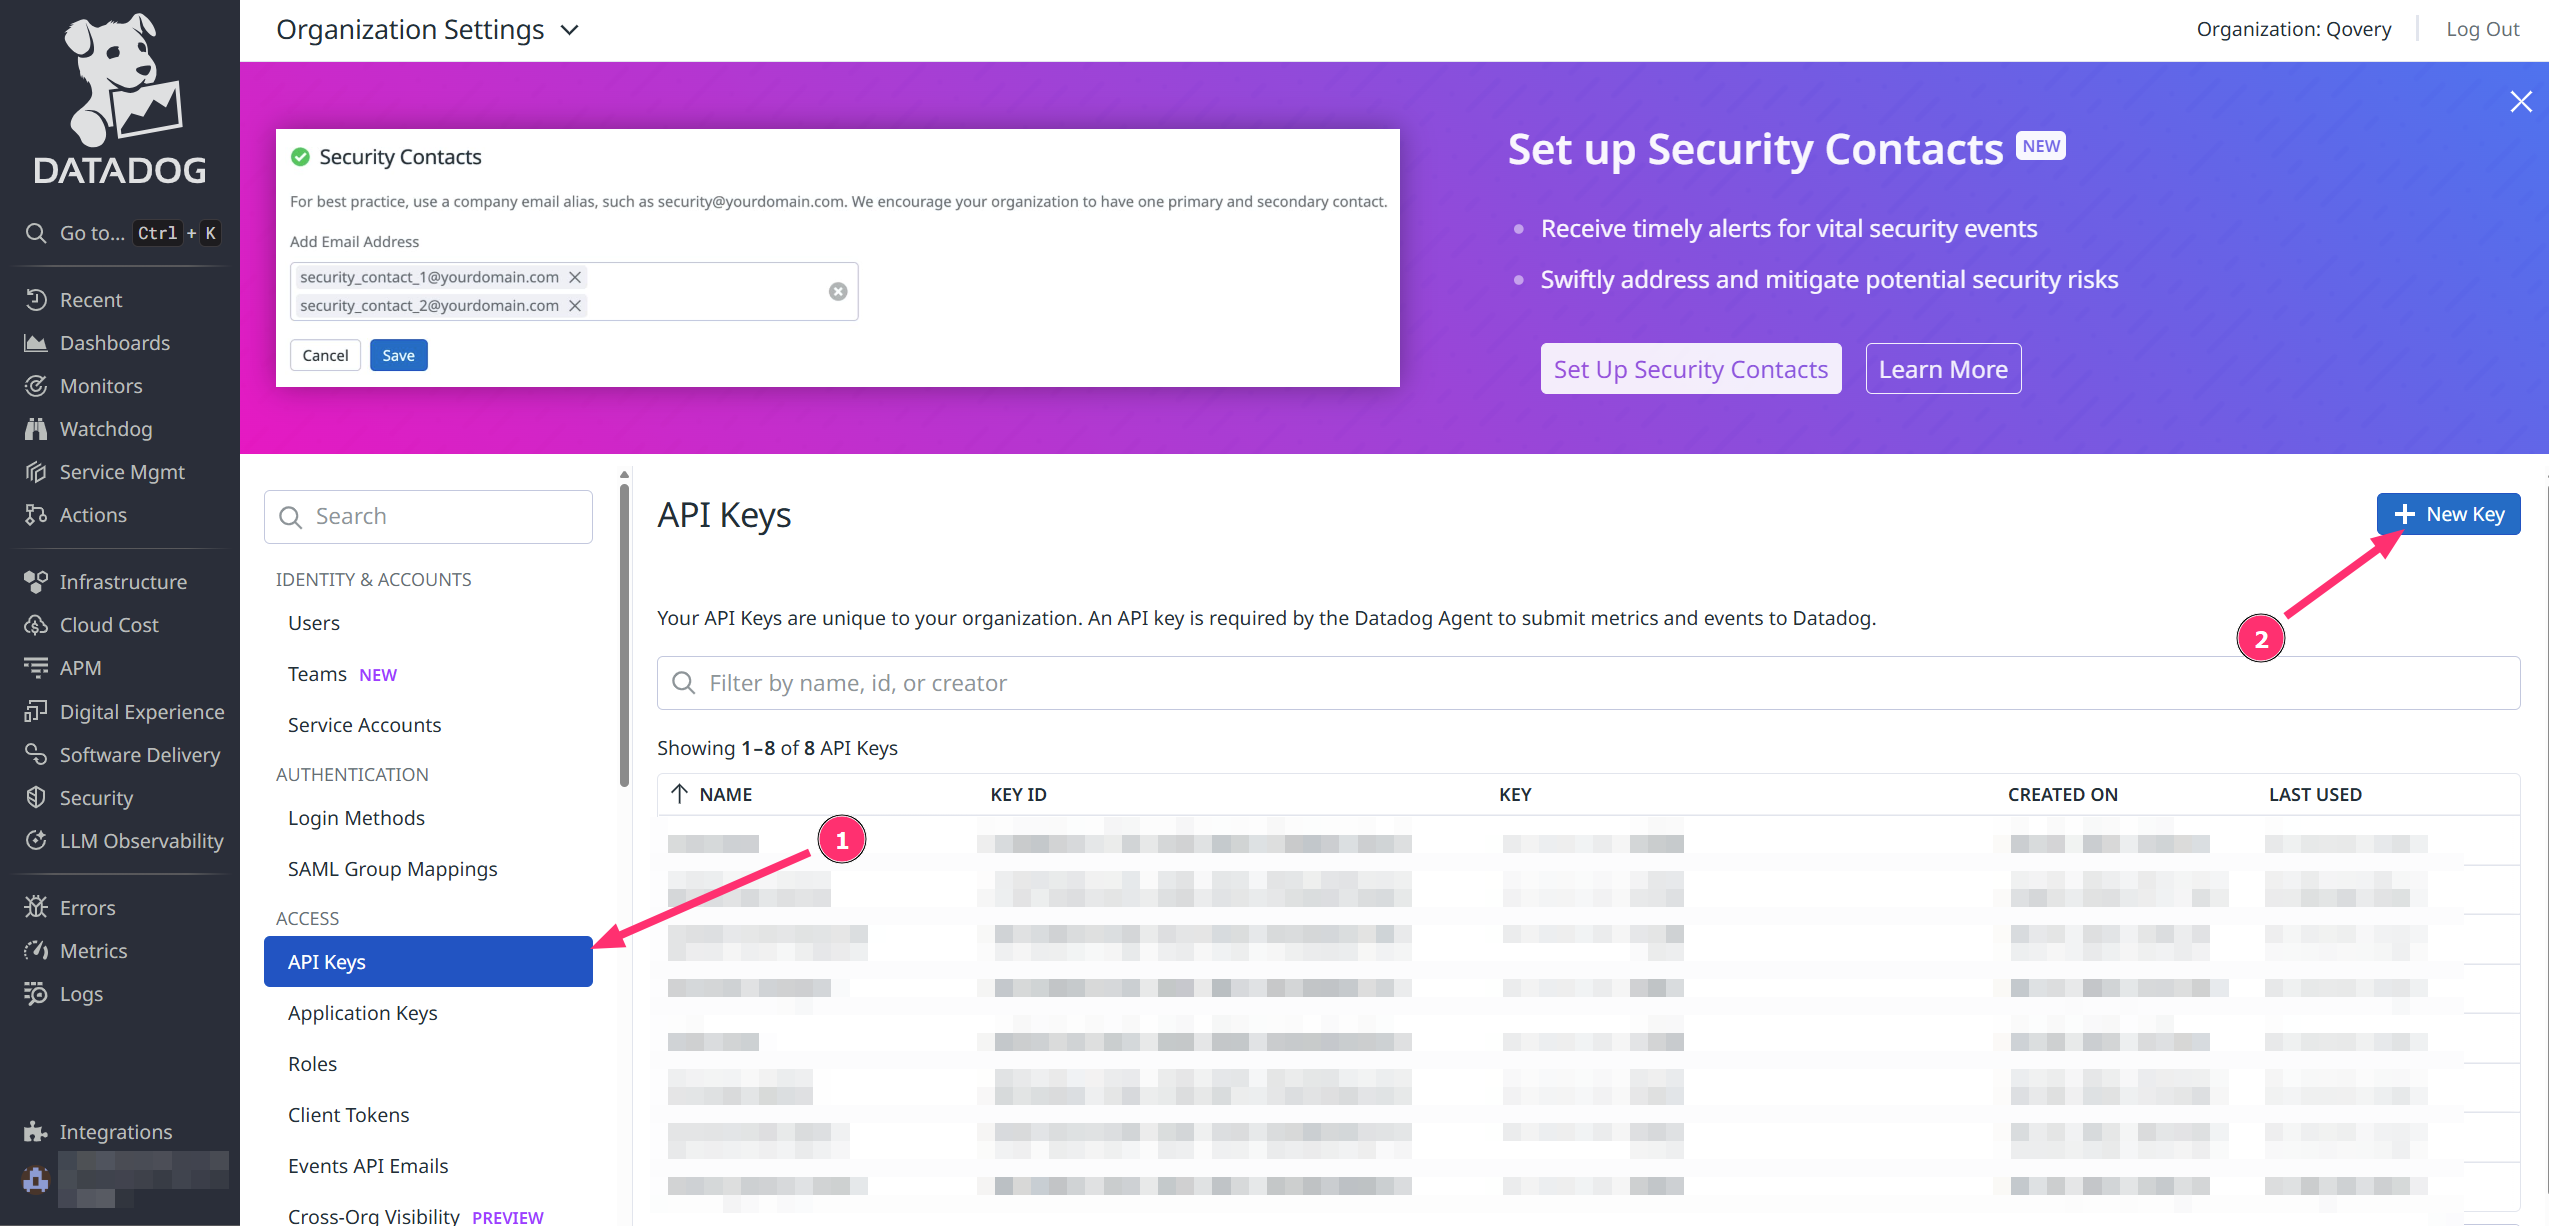
DD_API_KEY | Organization Settings → API Keys https://app.datadoghq.<region>/organization-settings/api-keys | Yes |
DD_APP_KEY | Organization Settings → Application Keys | Only for Database Monitoring |
DD_SITE | Your Datadog region (e.g., datadoghq.eu, datadoghq.com) | Yes |
CLUSTER_NAME | A friendly name you choose for your cluster | Yes |
Installation
In this tutorial, we will install the Datadog agent on a Qovery cluster to gather metrics about infrastructure and applications.This tutorial is based on a specific version of Datadog. We have created it to assist our users, but Qovery is not responsible for any configuration issues — please contact Datadog support for chart-specific questions.
Step 1: Add the Datadog Helm Repository
Add Helm Repository
In Qovery Console:
- Go to Settings → Helm Repositories
- Click Add Repository
- Configure:
- Repository name:
Datadog - Kind:
HTTPS - Repository URL:
https://helm.datadoghq.com
- Repository name:
Step 2: Create the Datadog Helm Service
Create Helm Service
In your dedicated environment:See Helm Charts for more details on creating a Helm service.
- Click Create → Helm Chart
- Configure:
- Application name:
Datadog - Helm source:
Helm repository - Repository:
Datadog - Chart name:
datadog - Version:
3.87.1(or latest from Datadog) - Allow cluster-wide resources: ✔️
- Application name:
If you prefer not to enable cluster-wide resources, see Step 3 for an alternative approach using values override.
Step 3: Configure Helm Chart Settings
The Datadog chart installs Custom Resource Definitions (CRDs) by default (e.g.,DatadogMetric, DatadogMonitor). You have two options:
- Option A: Allow cluster-wide resources (recommended)
- Option B: Disable CRDs in values
In the Helm service settings, enable Allow cluster-wide resources. This lets the chart create CRDs and ClusterRoles normally.This is the simplest approach and is recommended for most installations.
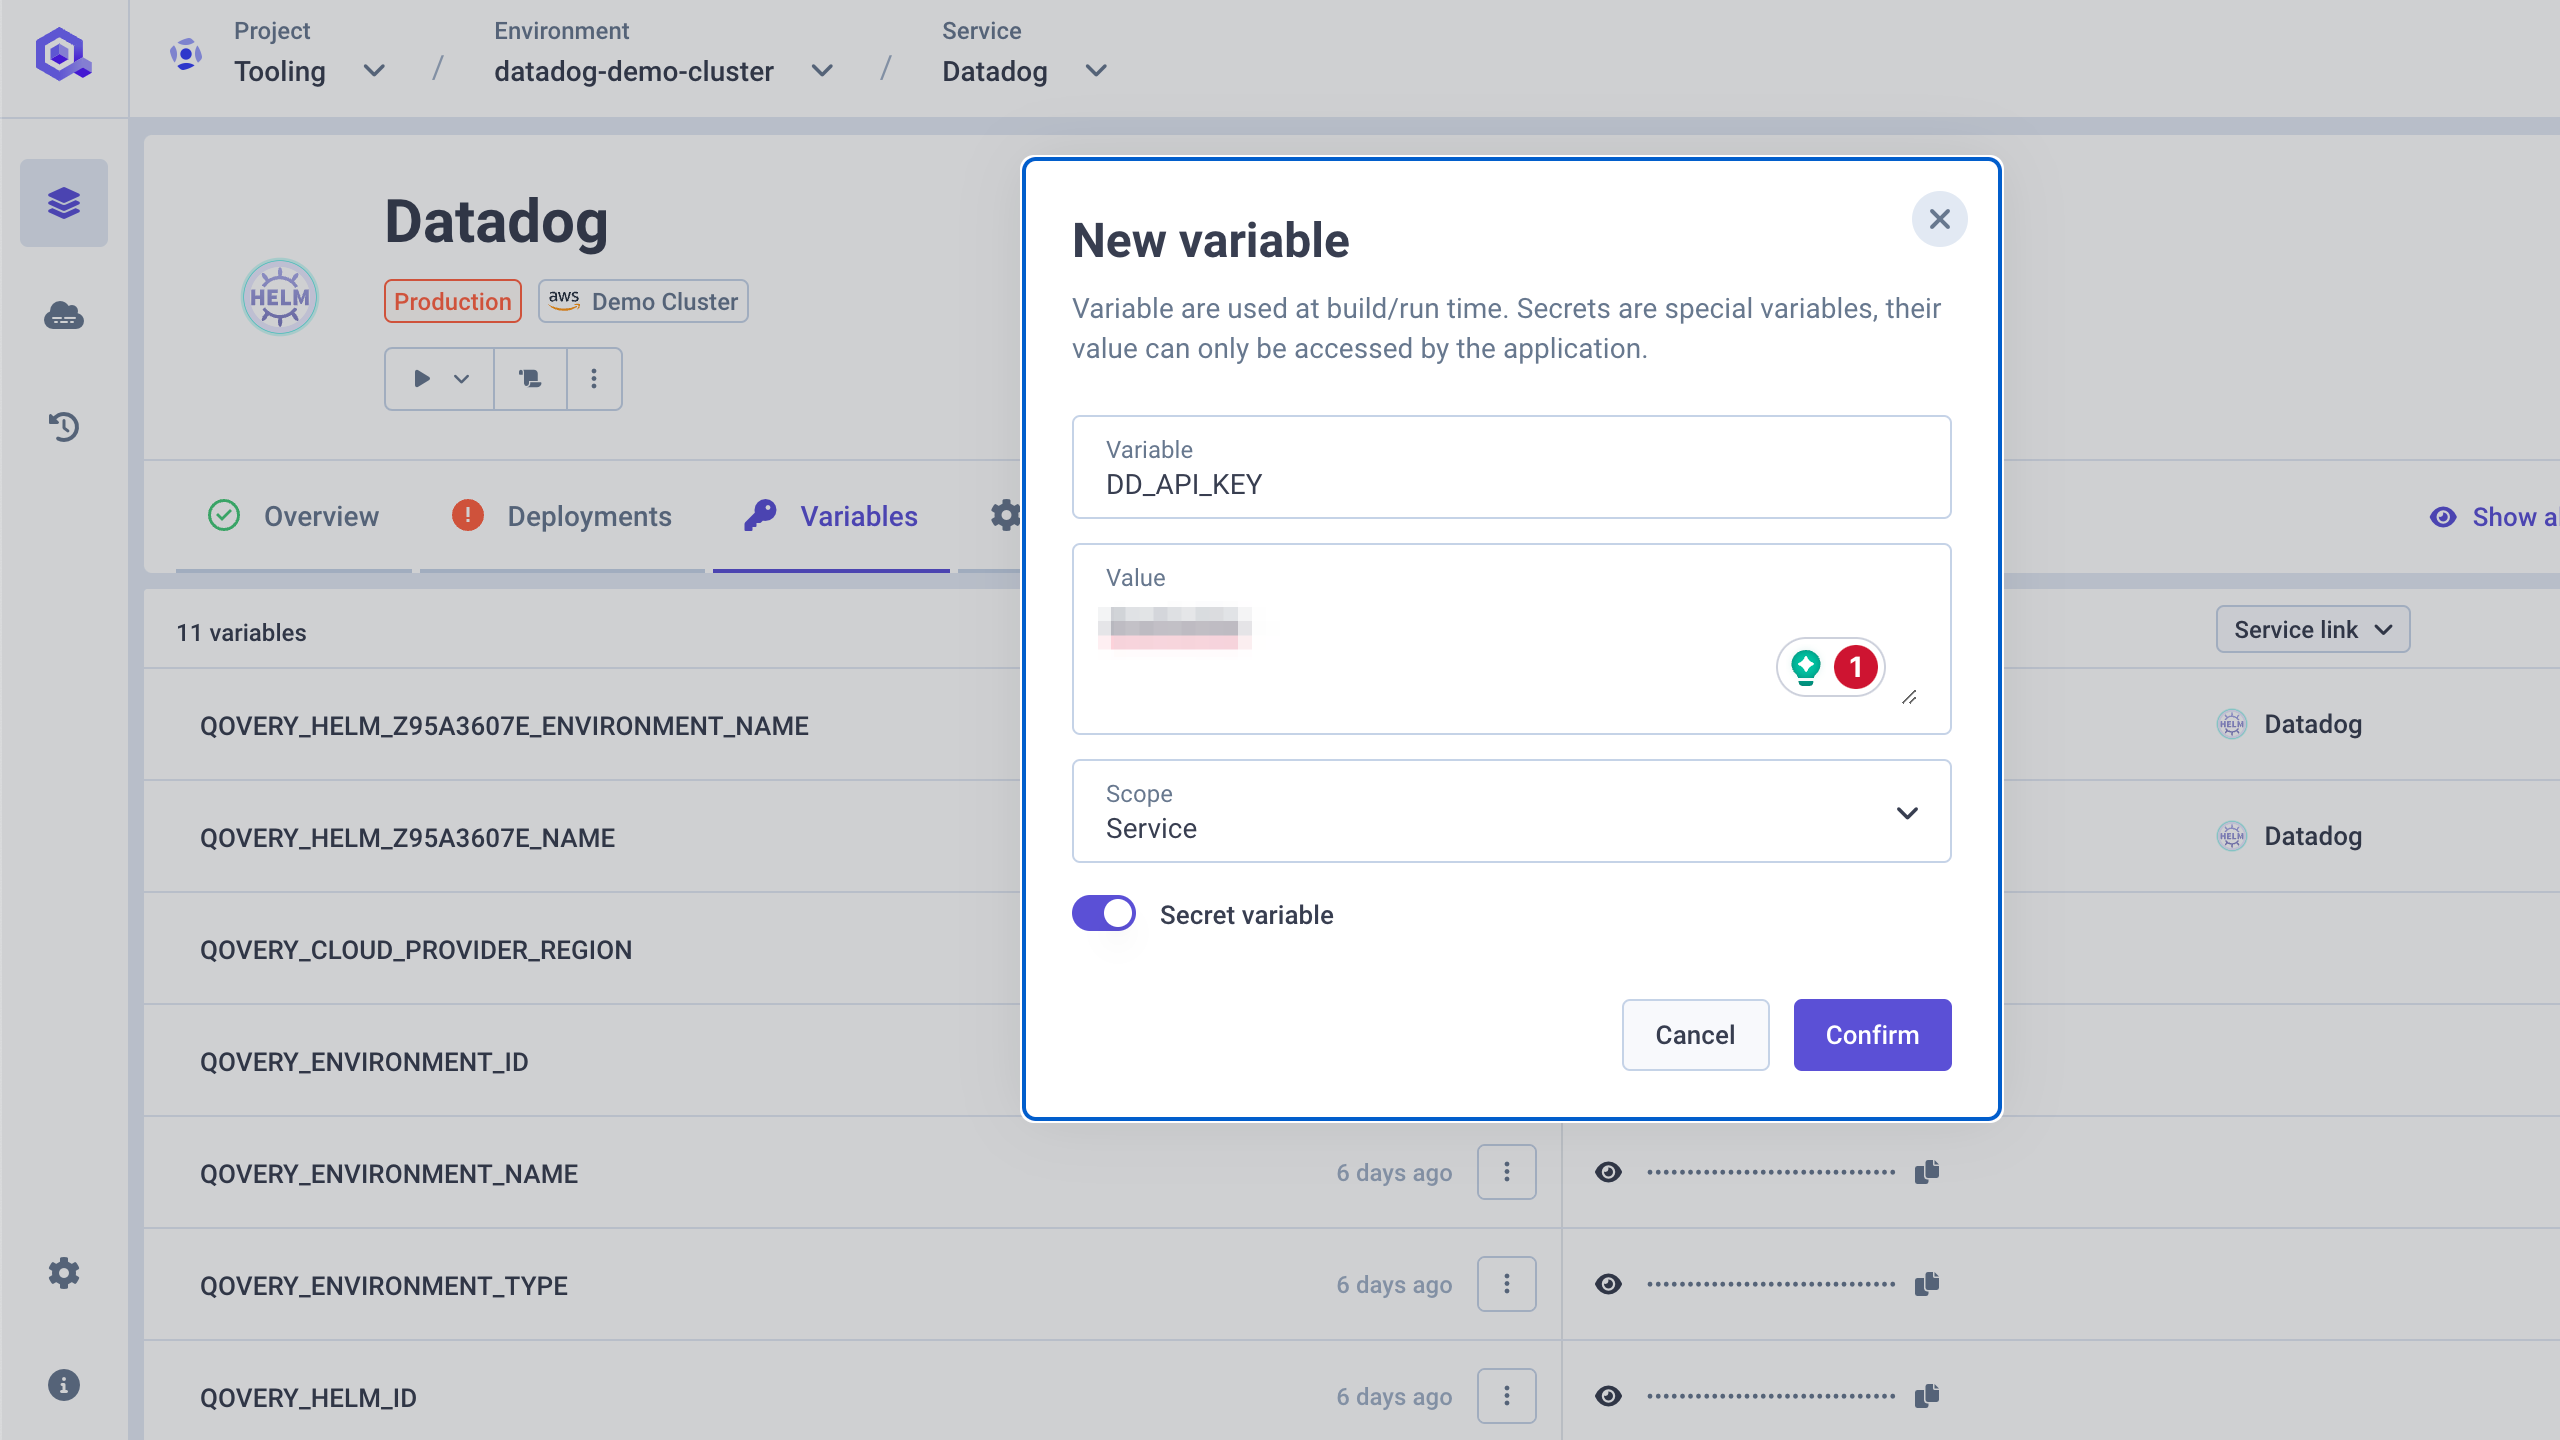
Step 4: Store Secrets and Variables
Add the API Key as Secret
- Open the Datadog service overview
- Go to the Variables section
-
Add a new variable:
- Variable:
DD_API_KEY - Value:
<your_API_KEY> - Scope:
Service - Secret variable: ✔️
- Variable:
Add optional variables
Add these additional variables as needed:
See Environment Variables for more details on managing variables in Qovery.
| Variable | Value | Scope | Secret | Notes |
|---|---|---|---|---|
DD_APP_KEY | <your_APP_KEY> | Service | ✔️ | Only needed for Database Monitoring |
DD_SITE | datadoghq.eu or datadoghq.com | Service | ❌ | Your Datadog region |
CLUSTER_NAME | my-cluster-name or alias of QOVERY_KUBERNETES_CLUSTER_NAME | Service | ❌ | Friendly name for your cluster |
Step 5: Configure Values Override
In the Override as file section of your Helm service, add the following minimal configuration:How
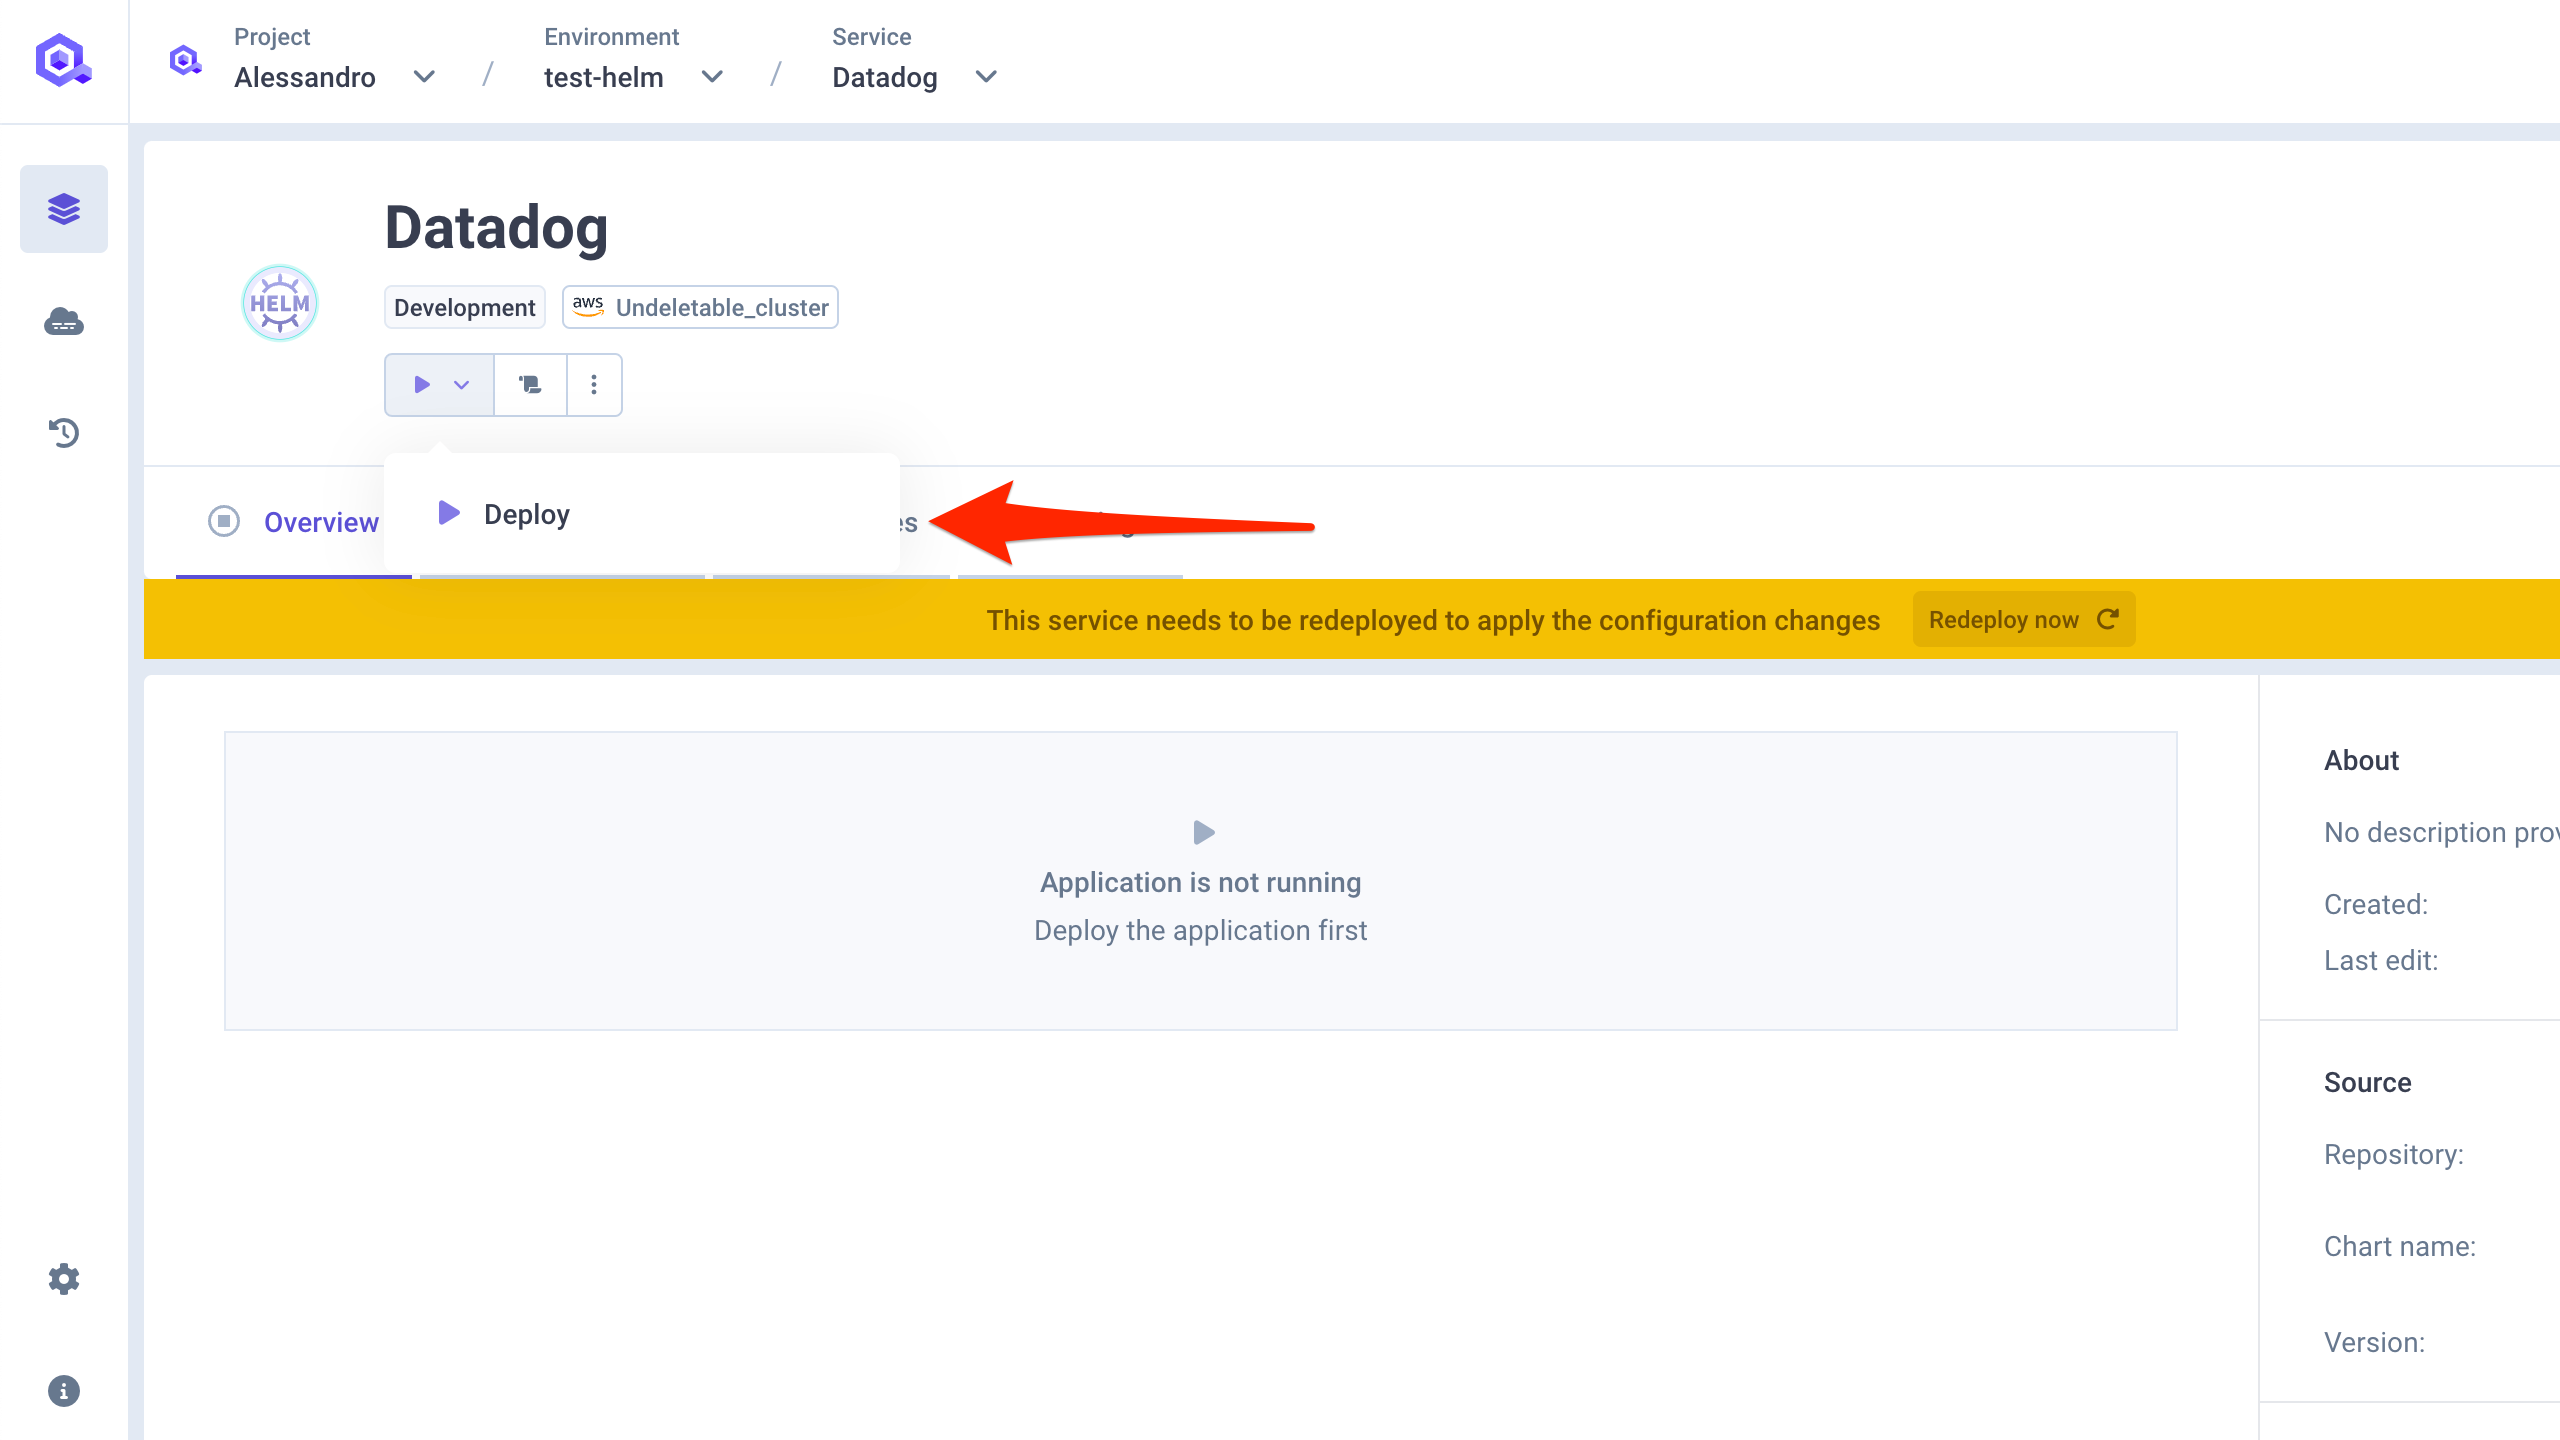
qovery.env.* works: At deploy time, Qovery replaces qovery.env.DD_API_KEY with the actual value of the DD_API_KEY variable. The real value never appears in the Qovery UI — it is only injected at Helm install time. See Environment Variables in Helm Values for more details.Step 6: Deploy the Chart
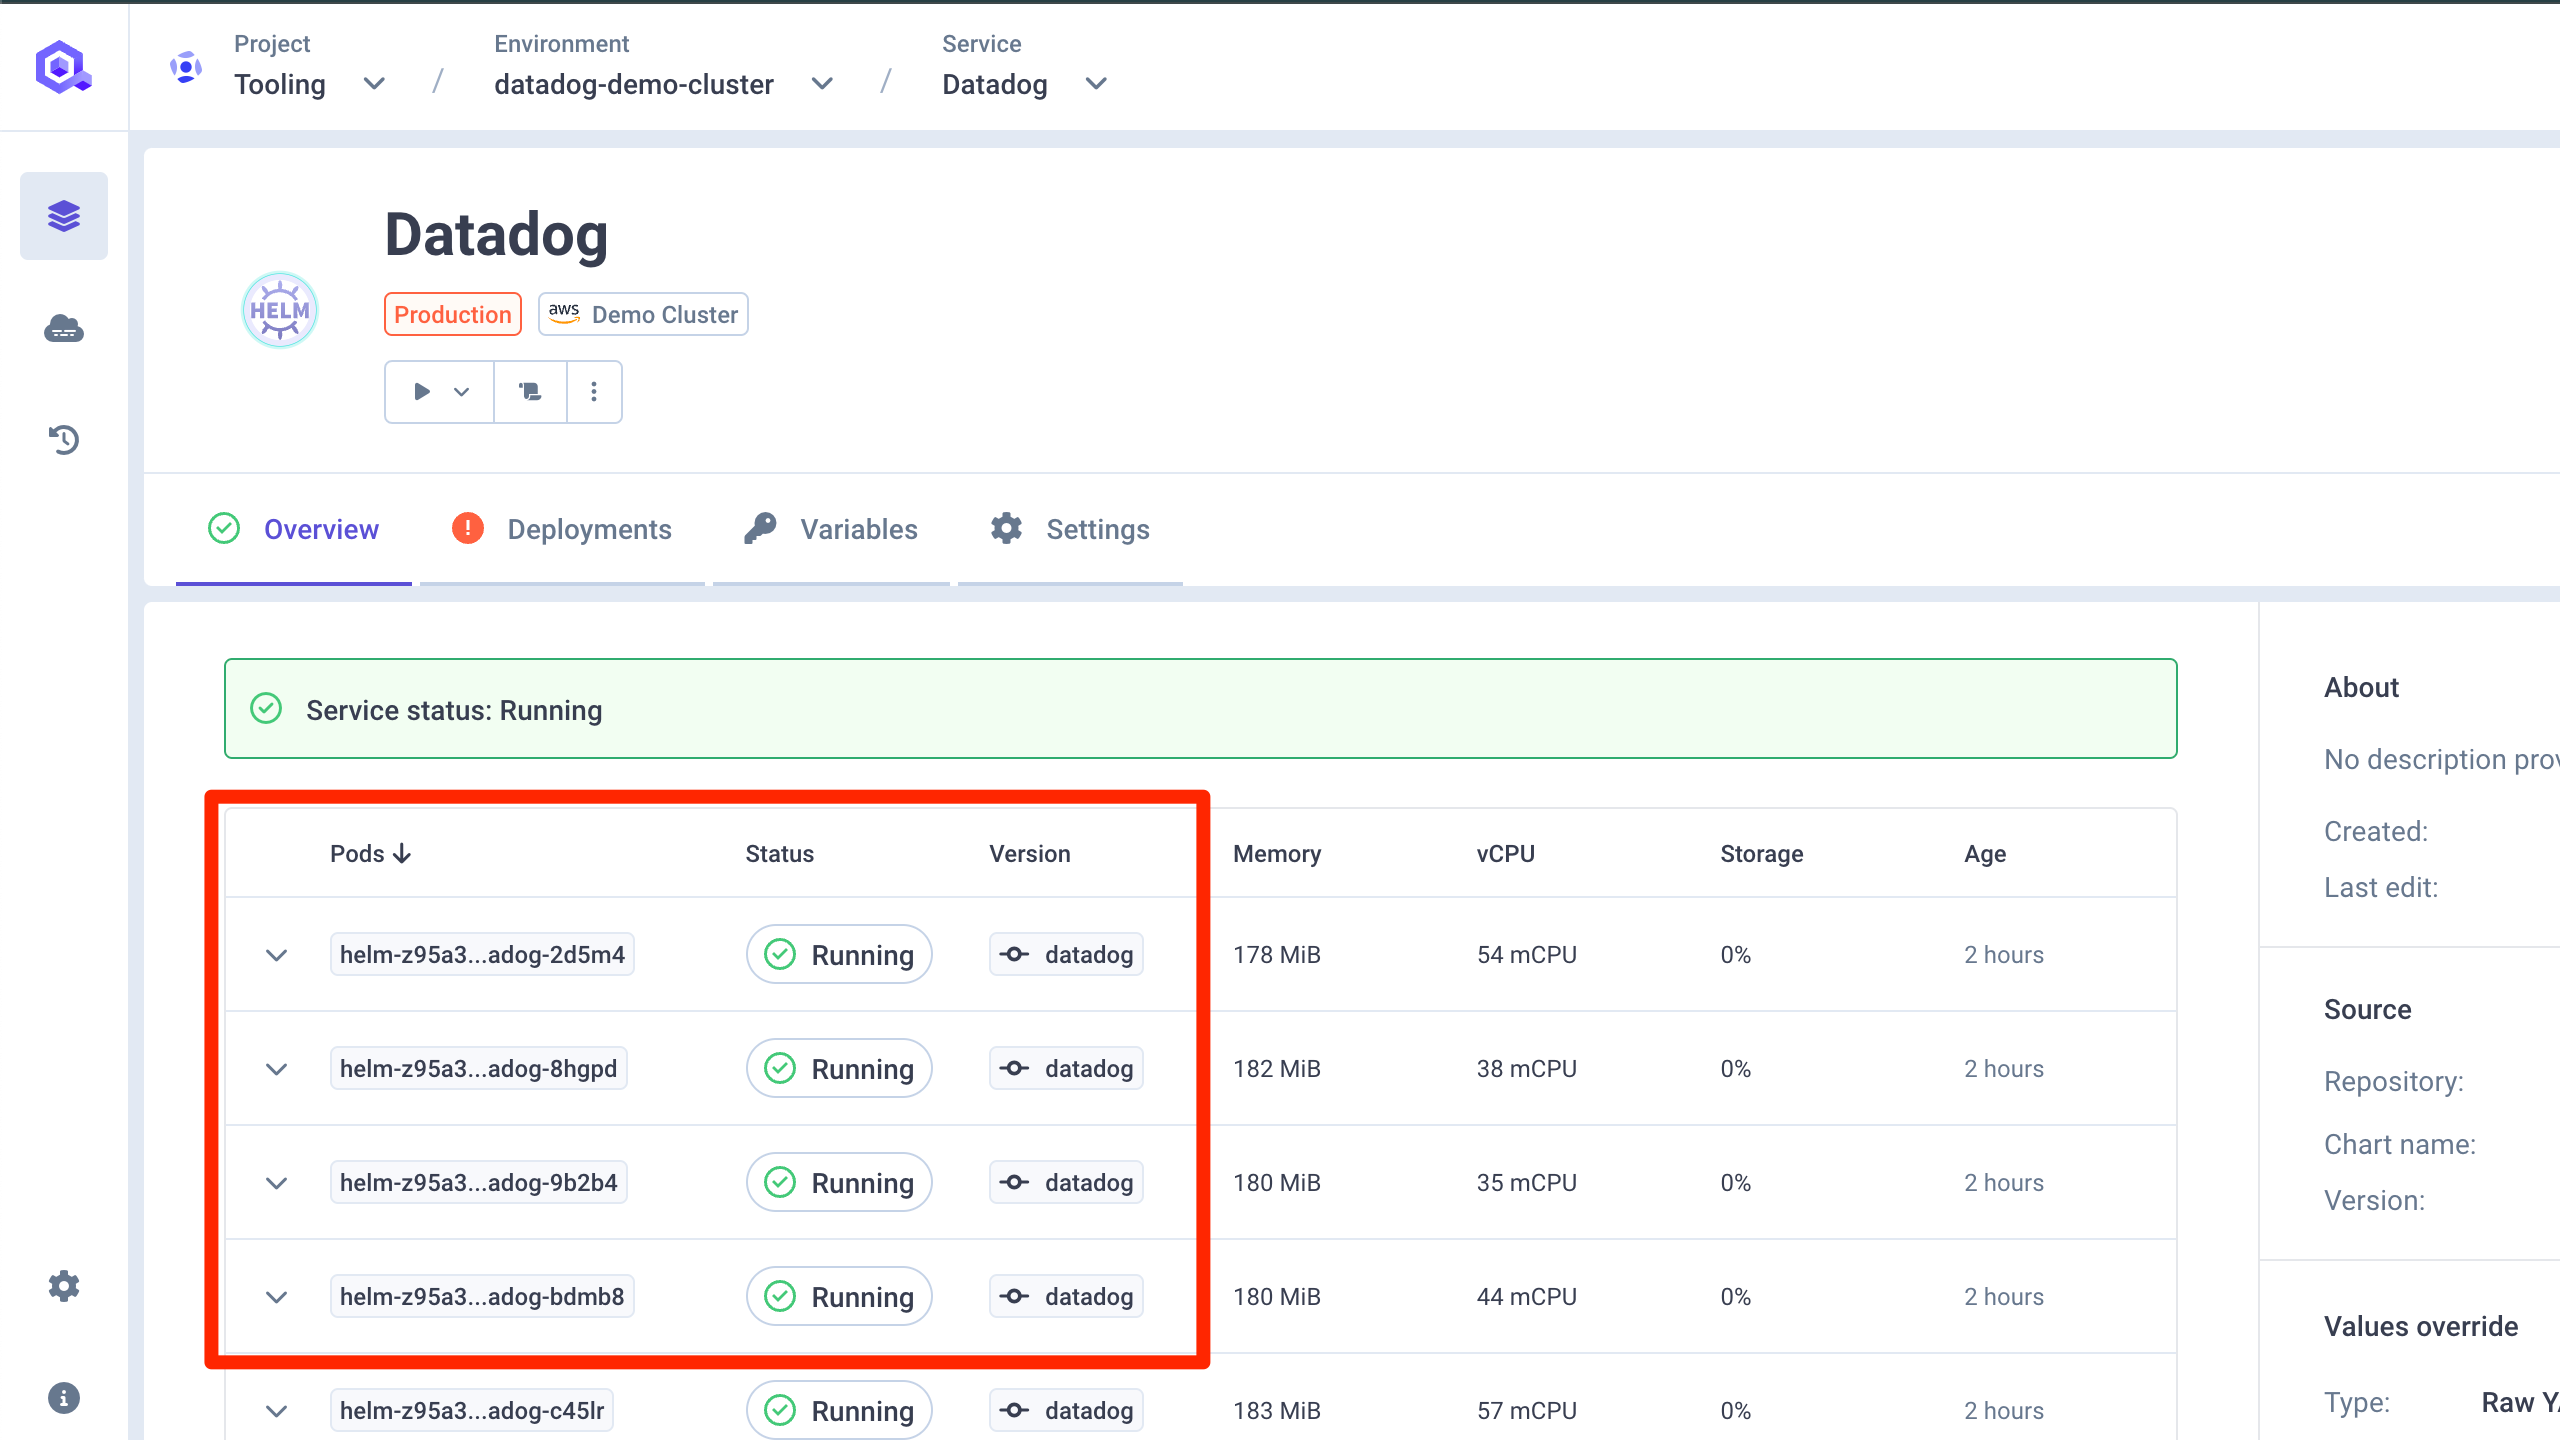
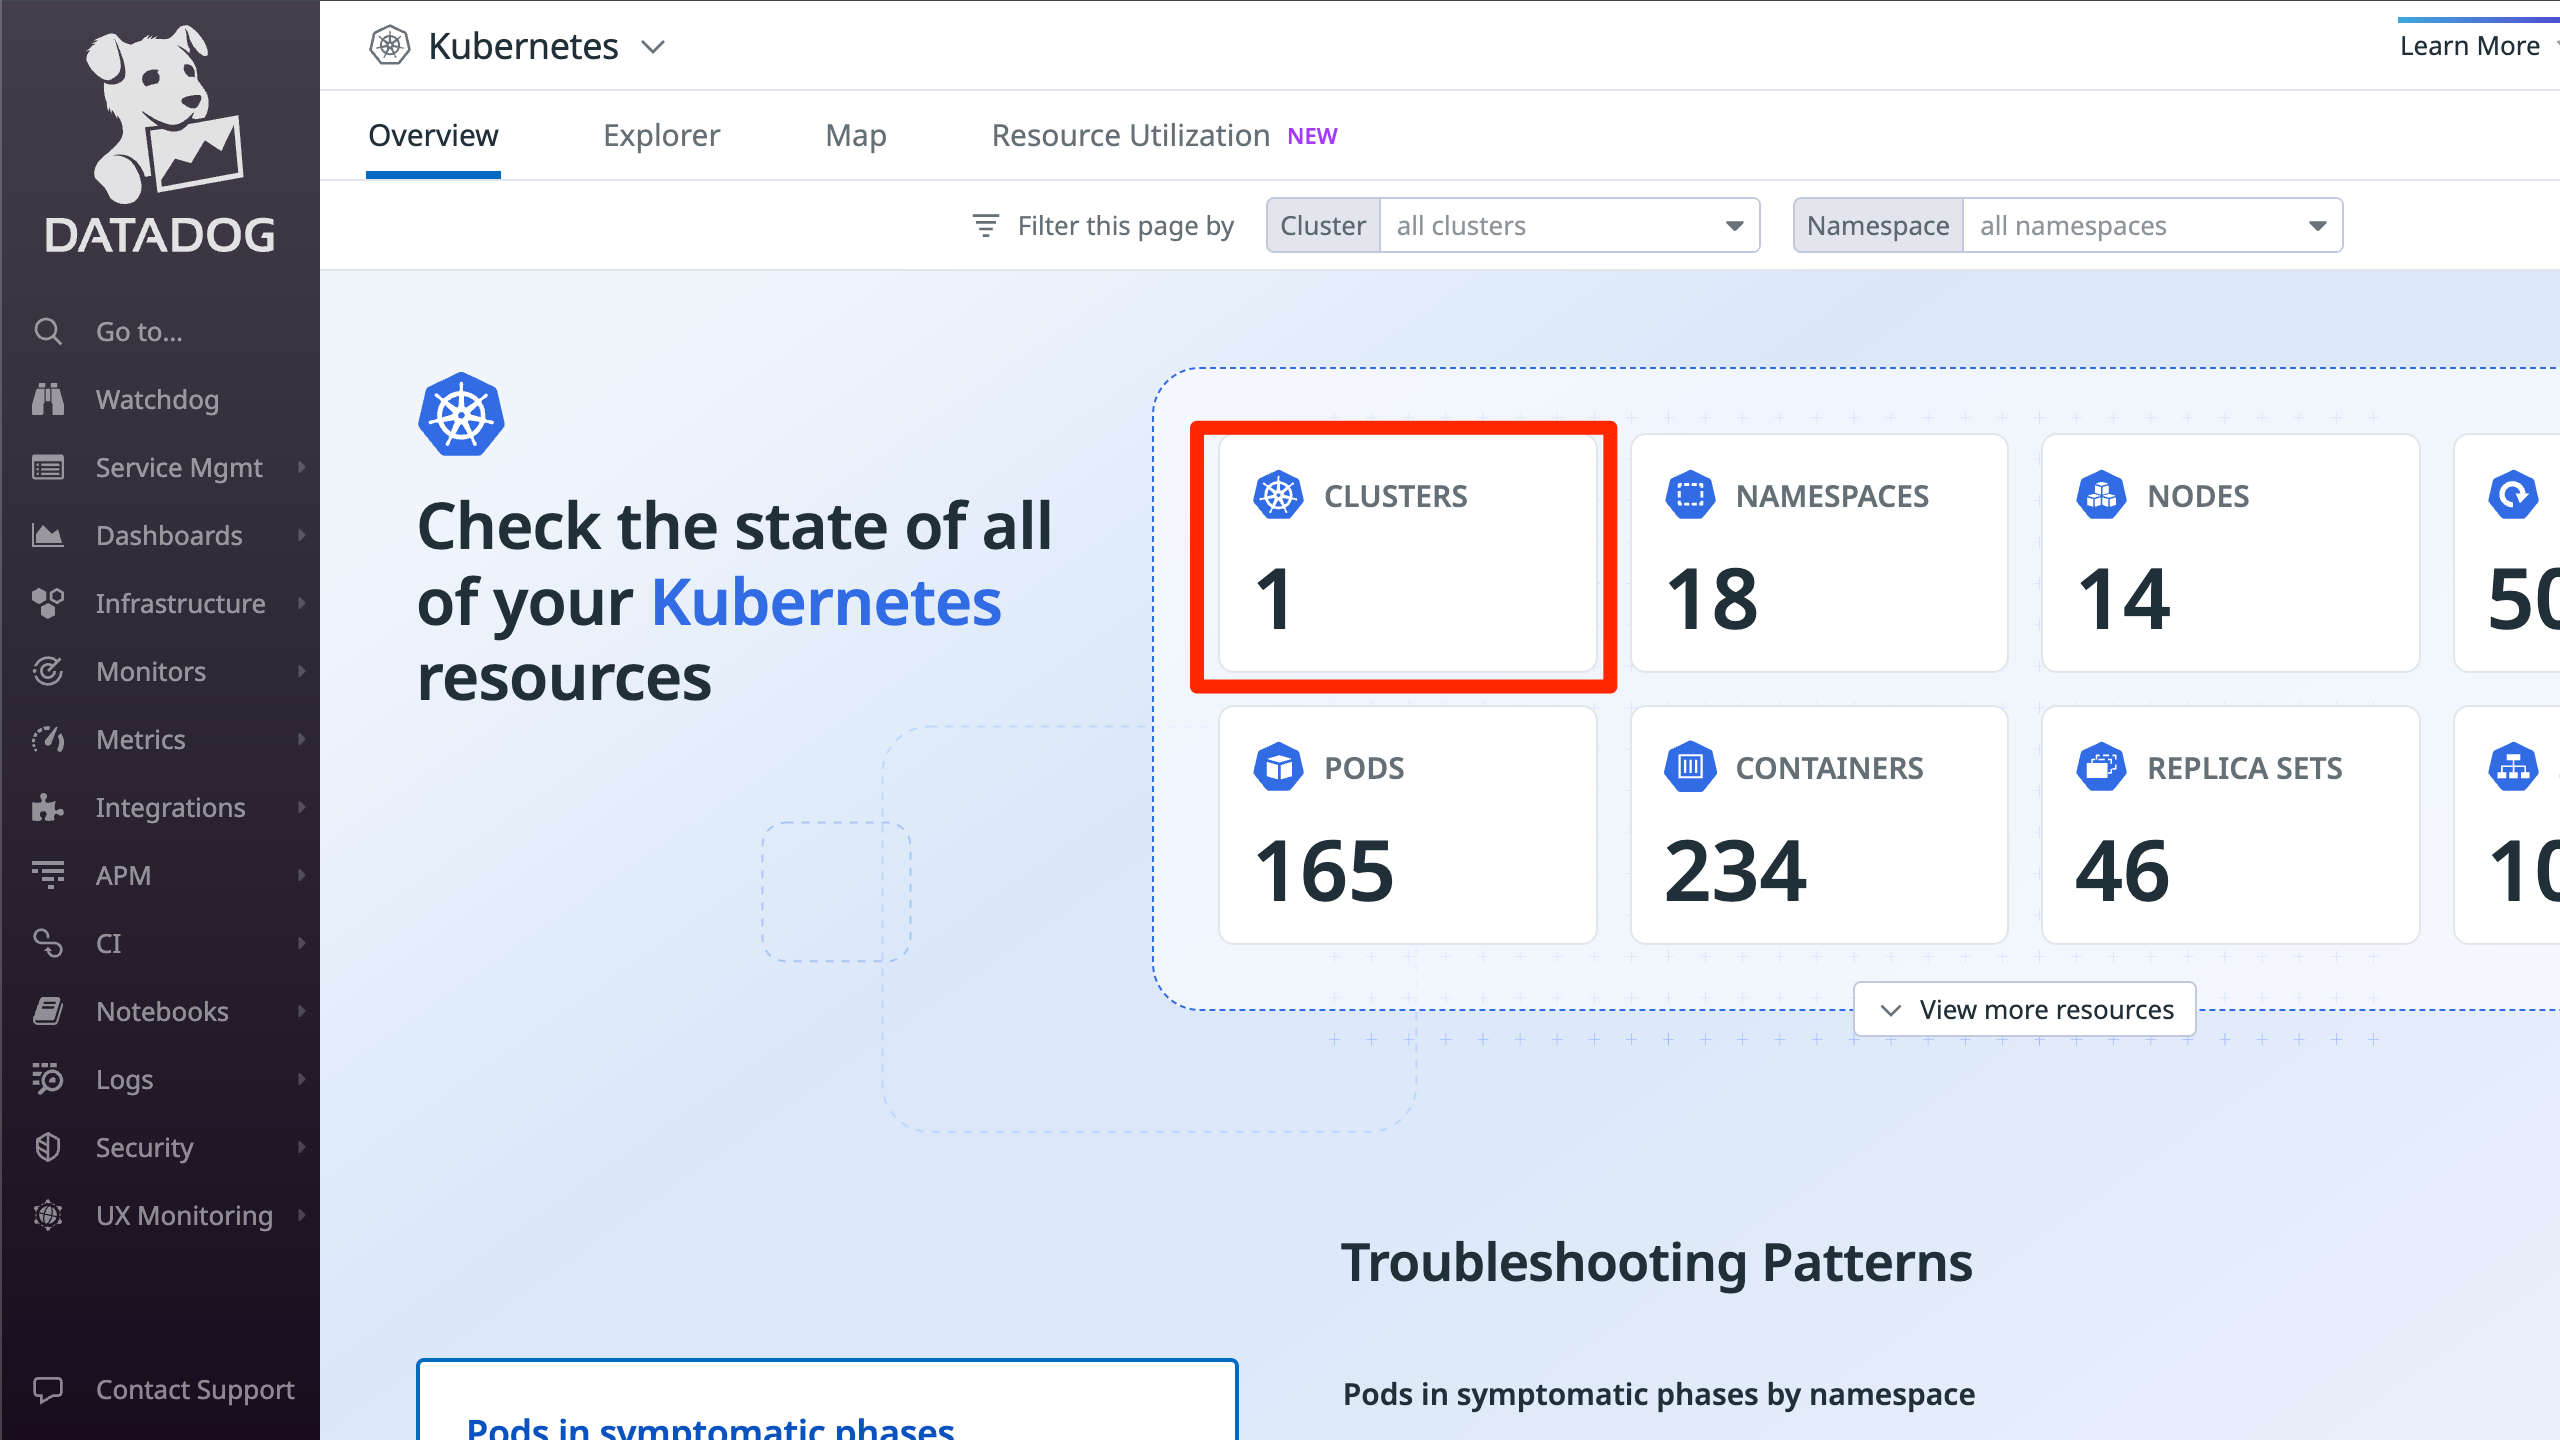
Step 7: Verify Setup on Datadog
Advanced Configuration
Log Collection
Enable log collection to stream container logs to Datadog:Unified Service Tagging
Unified Service Tagging ties Datadog telemetry (metrics, logs, traces) together using three standard labels. You can add them to your Qovery services via the Labels & Annotations feature:| Label | Value | Purpose |
|---|---|---|
tags.datadoghq.com/env | production | Environment name |
tags.datadoghq.com/service | my-api | Service name |
tags.datadoghq.com/version | 1.2.3 | Version |
Datadog Autodiscovery Annotations
For more granular control over log collection (e.g., setting a source, custom pipeline), add Datadog Autodiscovery annotations to your Qovery services via the Labels & Annotations feature:<container-name> with the actual container name of the pod.
Database Monitoring (PostgreSQL)
Datadog can monitor your PostgreSQL databases using Cluster Checks. This requires theDD_APP_KEY variable.
Create the monitoring user on PostgreSQL
On your PostgreSQL instance, create a dedicated
datadog user with the required permissions. See Datadog’s Database Monitoring docs for the full setup instructions.APM with Admission Controller
The Datadog Admission Controller can automatically inject the tracing library into your application pods — no code changes required:mutateUnlabelled is false, you must add the following label to your services (via Labels & Annotations) to opt in:
DD_AGENT_HOST, DD_ENTITY_ID, and inject the appropriate tracing library based on the language annotation:
java-lib, python-lib, js-lib, dotnet-lib, ruby-lib.
Manual APM Instrumentation
If you prefer not to use the Admission Controller, you can manually instrument your applications by adding these environment variables to your Qovery services:Recommended Production Configuration
Here is a comprehensive production-ready configuration that enables the most commonly used features:Troubleshooting
Deployment Issues
Timeout during deployment
Timeout during deployment
Problem: Helm deployment times out before completing.Cause: Datadog CRDs can take time to apply, especially on the first install.Solution: Add
--timeout 15m0s in the Helm Arguments field of your Datadog service in Qovery Console.CrashLoopBackOff on agent pods
CrashLoopBackOff on agent pods
Problem: Datadog agent pods are in
CrashLoopBackOff state.Possible causes and solutions:- Invalid API key: Check agent logs with
kubectl logs -n qovery datadog-agent-xxx. If you see authentication errors, verify yourDD_API_KEYis correct. - Resource limits too low: The agent may be OOMKilled. Increase memory limits (start with
512Mi, go up to1Giif needed). - Verify secret exists: Run
kubectl get secret -n qoveryto confirm the secret was created. - YAML syntax errors: Review your values override for indentation or syntax issues.
Pods not scheduling — maximum pods per node reached
Pods not scheduling — maximum pods per node reached
Problem: Datadog agent pods fail to start or stay in
Pending state, causing the deployment to time out. Node events show scheduling errors or IP address timeout messages.Cause: Since Datadog deploys a DaemonSet (at least one agent pod per node), if even a single node has reached its maximum pod capacity, the deployment will fail. This is common on clusters with many services or smaller instance types.Solutions:-
Set a high priority class so Datadog pods get scheduled before lower-priority workloads:
-
Ignore auto-detection of the Qovery cluster agent to avoid unnecessary pod conflicts:
-
Use a rolling update strategy to avoid scheduling all pods at once:
Configuration Issues
qovery.env.* values not interpolated
qovery.env.* values not interpolated
Problem: The Helm chart receives literal strings like
qovery.env.DD_API_KEY instead of the actual value.Cause: The variable name in the override doesn’t match the variable defined in Qovery.Solutions:- Variable names are case-sensitive:
qovery.env.DD_API_KEY≠qovery.env.dd_api_key - The variable must exist on the Helm service (correct scope)
- Check for typos in both the variable name and the override value
- See Environment Variables in Helm Values for details
CRD-related errors
CRD-related errors
Logs & Monitoring Issues
Application logs not appearing (Karpenter clusters)
Application logs not appearing (Karpenter clusters)
Problem: On a cluster with Karpenter enabled, some applications have their logs visible in Datadog but logs are missing for others.Reason: The Datadog agent DaemonSet likely has node selectors or taints/tolerations that prevent it from running on the stable nodes where some of your services have been scheduled. Services with only one pod typically run on the stable node pool, which explains why logs from these services are missing when Karpenter is enabled.Solutions:
-
Option 1 — Tolerate all taints (recommended):
-
Option 2 — Specific node pool tolerations:
No metrics in Datadog
No metrics in Datadog
Problem: Cluster appears in Datadog but no metrics are shown.Solutions:
- Wait 5-10 minutes for initial data to appear
- Verify the agent is scraping: check agent logs
- Ensure the correct
siteis set (datadoghq.comfor US,datadoghq.eufor EU) - Check that firewall/network policies allow outbound traffic to Datadog
Kubelet metrics missing
Kubelet metrics missing
Problem: Node-level metrics (CPU, memory per node) are missing.Cause: TLS verification failure when the agent contacts the kubelet.Solution: Set
kubelet.tlsVerify: false in your values override:APM Issues
Traces not arriving in Datadog
Traces not arriving in Datadog
Problem: APM traces are not visible in the Datadog APM dashboard.Solutions:
- Verify
DD_AGENT_HOSTpoints to the correct service:datadog-agent.qovery.svc.cluster.local - Confirm APM is enabled in the Helm values (
apm.portEnabled: true) - Check that port
8126is open and not blocked by network policies - Verify the application is correctly instrumented with the Datadog tracing library
Admission Controller not injecting tracing library
Admission Controller not injecting tracing library
Problem: The tracing library is not automatically injected into application pods.Solutions:
- Ensure the Admission Controller is enabled in the Helm values
- If
mutateUnlabelled: false, verify the labeladmission.datadoghq.com/enabled: "true"is set on the pod - Check the language annotation is set (e.g.,
admission.datadoghq.com/java-lib.version: "latest") - Check Cluster Agent logs:
kubectl logs -n qovery deployment/datadog-cluster-agent
Deployment Checklist
Use this checklist to verify your Datadog deployment:- Helm repository
Datadogadded in Organization Settings - Helm service created with chart
datadogand Allow cluster-wide resources enabled DD_API_KEYstored as a secret variable on the serviceDD_SITEandCLUSTER_NAMEconfigured as variables- Values override configured with
kubelet.tlsVerify: false - Log collection enabled if needed (
logs.enabled: true) - APM configured if needed (
apm.portEnabled: true) - Tolerations added if Karpenter is enabled
- Deployment successful — agent pods running
- Agent visible in Datadog → Infrastructure → Kubernetes
Useful Links
Datadog Helm Chart Values
Full list of configurable values for the Datadog Helm chart
Datadog Kubernetes Docs
Official Datadog Kubernetes agent documentation
Datadog APM Setup
Language-specific APM instrumentation guides
Datadog Log Collection
Kubernetes log collection configuration
Datadog Database Monitoring
PostgreSQL database monitoring setup
Qovery Helm Charts
Qovery documentation for deploying Helm charts
Qovery Environment Variables
Managing variables and secrets in Qovery
Deploy DaemonSet with Karpenter
Guide for deploying DaemonSets on Karpenter clusters